Liebe Leserinnen und Leser,
in unserem Oktoberausblick „Risk & Reward“ postulierten wir eine klare Meinung: Investmentlevels halten und die Kursschwäche für Zukäufe nutzen, trotz des hohen Risikos rund um Evergrande und die Zins- und Tapperingängste. Unsere von CAESAR optimierte Analyse traf voll ins Schwarze und die Börse belohnte mutige Anleger mit stolzen Kursgewinnen: So ist der S&P 500 auf Monatssicht um +5% gestiegen, der Nasdaq sogar um +6,5%. Unser AI Global Opportunity Fund, der fokussiert in Wachstumsaktien investiert, konnte um +7,5% zulegen und unser neu emittiertes Zertifikat Alpha AI US leveraged sogar um +11%.
Nachrichten, wie die von Evergrande gehören an der Börse dazu und erwischen viele Anleger immer wieder auf dem falschen Fuß. Unsere Systeme berücksichtigen hingegen keine Schlagzeilen, da wir uns voll auf unsere Datenbasis abstützen. Unser Ziel ist es, Ihnen eine transparente Sicht auf die wesentlichen Indikatoren zu geben, welche die Börsen beeinflussen.
Der November 2021 könnte wieder ein besonderer Börsenmonat werden und nicht minder anspruchsvoll als der Oktober. Unser Kapitalmarktausblick, soll einmal mehr Licht (Yin) in den dunkeln Datendschungel (Yang) bringen, damit Sie optimal für den Jahresendspurt positioniert sind.
Ausblick November: Yin & Yang
Welche Guidance gibt uns CAESAR für die letzten Wochen des bisher exzellenten Börsenjahres 2021.
Grundsätzlich bleibt die Mehrzahl der überwachten Indikatoren wie Zinsspreads oder FED Geldmenge weiter komfortabel im grünen Bereich. Wie immer haben wir Ihnen wichtige Indikatoren in der Sektion Leading Indicators dargestellt. Die Rendite der 10-jährigen US-Staatsanleihe ist in der letzten Oktoberwoche wieder auf 1,57% gefallen. (Chart 1. 10 year US Treasury) Das fallende Zinsniveau unterstützt vor allem den hoch bewerteten Tech-Sektor, um die sicher hohen Niveaus zu halten. Im Oktober haben sich viele Indizes technisch deutlich erholt, und wieder Ihren kurzfristigen Abwärtstrend verlassen. Unser System trackt u.a. den MSCI World Index, der alle wichtigen Weltregionen abdeckt. Solange der Index über dem 50 Tage Durchschnitt notiert, bleibt das positive Anlageumfeld erhalten. (Chart 2: MSCI World Index). Eine negative Tendenz bildet der Metallpreisindex aktuell aus. (Chart 3: Metals). Seit Mitte Oktober ist ein Preisrückgang zu erkennen, der eine abschwächende Wirtschaftsleistung vermuten lässt. Aktuell liegt der Indikator aber noch im grünen Bereich.
Auch unser auf Marktrisikoindikatoren optimiertes Frühwarnsystem hat am 13.10 wieder Entwarnung signalisiert und uns in unseren renditeoptimierten Strategien mit Leverage in die Märkte zurückkatapultiert.
Fazit:
Unsere übergeordneten Markteinschätzung bleibt unverändert bullish. Anleger, die aber sehr risikoavers agieren, können auf dem aktuellen Kursniveau durchaus einmal bei heiß gelaufen Werten über Gewinnmitnahmen nachdenken. Die wiederaufblühende Euphorie nach der Angstphase im Oktober ist eher als Warnzeichen zu werten. Der vielbeachtete CNN Fear & Greed Index liegt seit kurzem wieder im Greed Bereich.
Betrachtet man aber die Saisonalität, könnten die stärksten Wochen des Jahres durchaus noch vor uns liegen. Der November ist im Schnitt mit fast 2,5% Rendite einer der besten Monate des Jahres. Aktuell treffen am Markt hohe Bewertungen, gepaart mit einem Schuss Euphorie auf die kommenden saisonal starken Monate.
Für unsere Private Alpha Anlageexperten, die über jahrzehntelange Erfahrung im Private Banking verfügen, steht das Pendel nun wieder genau in der Mitte. Yin und Yang liegen derzeit sehr ausbalanciert. Wir erwarten normale Marktrenditen für die kommenden Wochen. Nach der großen Verunsicherung sind viele Anleger wieder an den Markt zurückgekommen. Nochmalige explosive Kurssteigerungen, wie in den vergangenen Wochen wären daher eher eine Überraschung.
In unseren Strategien lassen wir uns weiter von CAESAR leiten, halten unsere hohen Investmentlevels, sind aber jederzeit bereit diese auch zu reduzieren, falls unser hoch agiles Risikofrühwarnsystem, eine Warnung generieren sollte.
Leading Indicators:
Die Indikatoren werden von CAESAR benutzt, um eine ideale Investmentquote sowie Risikoanalysen für die globalen Aktienmärkte zu definieren.
Chart 1: 10 Year US-Treasury
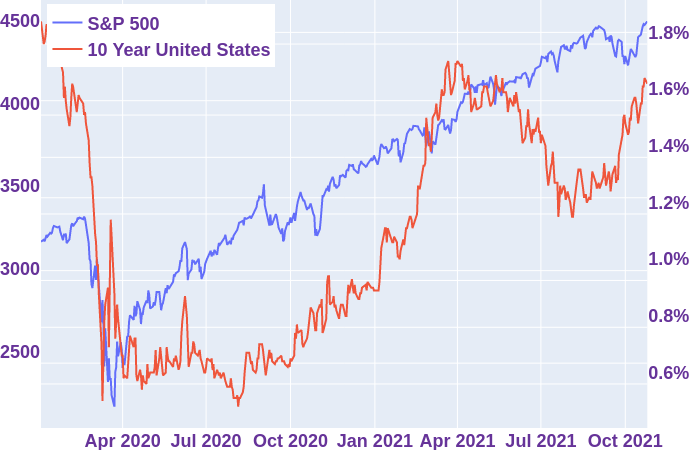
Fazit: Der 10-Jahreszins der US-Staatsanleihe ist ein wichtiger Indikator für den S&P 500. Der Anstieg im September ist kurzfristig negativ einzustufen. Zum Start in den November liegt das Zinsniveau bei 1.57%.
Chart 2: MSCI World Index
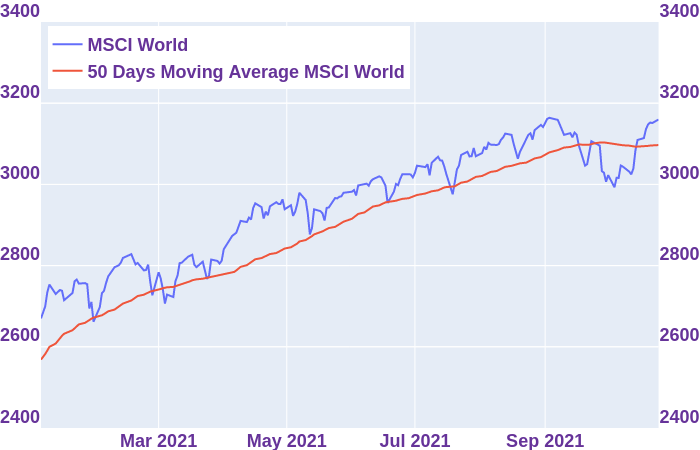
Fazit: Der 50 Tage Moving Average auf dem MSCI World Index ist ein wichtiger Indikator, der die technische Lage im Markt anzeigt. Dieser Indikator zeigt, dass die Bullen aktuell wieder das Ruder in der Hand halten, indem der Indikator über den Aufwärtstrend gestiegen ist.
Chart 3: Metals Index
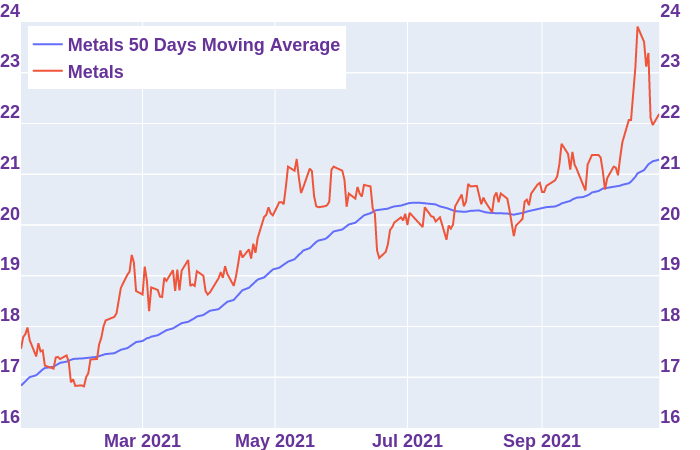
Fazit: Der Metallpreis Index ist ein wichtiger Indikator, der die Konjunkturdynamik im Markt anzeigt. Dieser Indikator signalisiert, aktuell eine sich leicht abschwächende Preisentwicklung. Eine wirtschaftliche Abkühlung könnte daher vor uns liegen.
Marktrisiko: Das von CAESAR gemessene Marktrisiko für eine deutliche Korrektur liegt bei niedrigen 8%. Grundlagen dieser Analyse sind von CAESAR ausgewertete untereinander unabhängige Risiko-indikatoren. Aus Risikosicht kann derzeit weiter mit einer übergewichteten Investmentquote investiert werden. Der Leverage in unserer renditeoptimierten Strategie haben wird verwendet.
Produkteupdate:
Private Alpha AI Global Opportunity Fund:
Der AI Global Opportunity Fund konnte im Oktober deutliches Alpha zum Markt aufbauen. Auf Monatssicht erreichten wir 7,5% Rendite und schlagen somit den Benchmarkindex Nasdaq100 um 1%. Unser im Juni nochmals verbesserter Aktienalgorithmus hat uns rechtzeitig in Tesla und Nvidia investiert lassen, die derzeit explosive Kurssteigerungen aufweisen. Unser Portfolio ist bestückt mit Digitalisierungsgewinnern. Wir erwarten weiter steigende Kurse bis zum Jahresende.
Alpha AI Sustainable:
Unser Alpha AI Sustainable Zertifikat konnte im Oktober um 8,5% zulegen. Seit Start der Strategie vor 16 Monaten liegen wir nun 59% im Gewinn. Unser Rockstar mit einer Kursverdreifachung (3x) nach 6 Monaten ist aktuell Standard Lithium Ltd. Die gesamte Branche der erneuerbaren Energien und Technologien, die den Klimawandel stoppen sollen, liegen voll in der Gunst der Anleger. Die UN-Klimakonferenz, die Anfang November im Glasgow beginnt, sollte nochmals zusätzlichen Rückenwind generieren. Wir sind weiter davon überzeugt, dass renditestarke Monate vor uns liegen.
AI-optimierte Index Tracker Zertifikate auf die führenden Aktienindizes
Am 22. September haben wir unser neues Alpha AI US leveraged Zertifikat an der Börse emittiert. Das Zertifikat ist ein smarter Indextracker auf die beiden Indizes S&P 500 & Nasdaq 100 mit Risikoschutz durch die KI-Überwachung. Kurz gesagt, das Zertifikat soll in guten Marktphasen zweifach an der Aufwärtsbewegungen der Benchmark Indizes: S&P 500 & Nasdaq 100 partizipieren, bietet aber gleichzeitig auch zusätzlichen Schutz bei grösseren Marktkorrekturen. Das Marktexposure kann zwischen -20% bis 200% schwanken, wobei in “normalen Phasen” ein zweifacher Hebel vorgesehen ist.
Der Start verläuft weiter exzellent! Der Oktober brachte explosive Gewinne von 11%. Für risikofreudige Anleger eine ideale Depotbeimischung.
Unser Strategien Alpha AI US 500 und Alpha AI US Tec 100 konnten ebenfalls überzeugend zulegen. Alle unsere Strategien liegen auf Jahressicht deutlich in der Gewinnzone!
Performance Update:
| Name | 1M | YTD | 1Y |
| AI Global Opportunity, $ | +7,5% | +9,5% | +18,5% |
| DE000A2JQKU8 | |||
| Alpha AI Sustainable, € | +8,5% | +13,5% | +38,0% |
| DE000LS9QPW3 | |||
| Alpha AI US 500, € | +3,5% | +22,5% | +28,5% |
| DE000LS9QPV5 | |||
| Alpha AI US Tec 100, € | +3,5% | +20,0% | +28,0% |
| DE000LS9QQJ8 | |||
| AI Swiss Index, CHF | +5,3% | +8,8% | +14,0% |
| CH0489814233 | |||
| AI Swiss Index, € | +5,5% | +9,0% | +14,6% |
| DE000VE2UH16 | |||
| Alpha AI US Leverage, € | +11,0% | +8,5% | n/a |
| DE000LS9SGD8 |
Stand 29.10.2021
Wir wünschen Ihnen einen guten Start in den Oktober.
Ihr Private Alpha Team
Überzeugen wir Sie mit unseren Analysen. Hier kostenlos zum monatlichen Update anmelden, um zukünftig kein Update mehr zu verpassen. –> Research anmelden

Social Media